HEG Ltd: Channel Breakout Signals Potential Upside to 2630HEG Ltd has garnered attention in recent trading sessions with its notable technical developments. The stock is showing signs of a potential breakout from its current trading channel, particularly if it manages to surpass the critical resistance level at 2050. Such a breakout could pave the way for a significant upward movement, with targets potentially reaching as high as 2630. Let's delve into the technical analysis to understand the potential trajectory of this breakout.
Technical Analysis:
Channel Breakout: HEG Ltd appears poised for a breakout from its prevailing trading channel, marked by a decisive move above the resistance level at 2050. This breakout suggests a shift in market sentiment towards bullishness, potentially indicating an influx of buying interest.
Volume Confirmation: Confirmation of the breakout is crucial, and a surge in trading volume accompanying the move above 2050 would strengthen the bullish case. Elevated trading volume during a breakout typically signals strong investor participation, reinforcing the validity of the upward momentum.
Moving Averages: Monitoring the moving averages, particularly the 50-day and 200-day moving averages, provides insights into the stock's trend direction. A bullish crossover, where the shorter-term average moves above the longer-term average, could further validate the bullish bias and support the continuation of the upward movement.
Relative Strength Index (RSI): The RSI indicator can provide additional confirmation of the stock's momentum. If HEG Ltd enters into the overbought territory, it would suggest strong buying pressure and potentially indicate further upside potential. However, traders should also be mindful of potential pullbacks that may occur due to overextended conditions.
Price Targets: Based on the breakout confirmation and technical analysis, HEG Ltd could aim for price targets around 2630 in the near to medium term. Traders and investors may consider this level as a potential area for profit-taking or reassessment of positions.
Risk Factors:
Market Volatility: While the technical setup appears promising, market volatility can always pose a risk to anticipated price movements. Traders should remain vigilant and implement risk management strategies to mitigate potential losses.
External Factors: External factors such as macroeconomic indicators, industry-specific news, or regulatory changes can influence HEG Ltd's price trajectory. It's essential to stay informed about relevant developments that may impact the stock's performance.
Conclusion:
HEG Ltd's potential breakout above 2050 presents an intriguing opportunity for traders and investors. With technical indicators supporting further upside potential, the stock could target levels around 2630 in the near future. However, prudent risk management practices are essential to navigate potential market uncertainties effectively. As always, conducting thorough research and consulting with financial professionals is advisable before making any investment decisions. Keep a close eye on HEG Ltd's price action for confirmation of the anticipated breakout. Happy trading!
Search in ideas for "STRONG BUY"

IFBIND / IFB INDUSTRIES LTD - 3 Years Downtrend Channel BreakoutIFBIND
1) Time Frame - Weekly.
2) The Stock has been consolidating in a downtrend channel since 2021 & Now It has given a 3 years Downtrend breakout with huge volume & strong bullish candle close in weekly.
3) The next target / resistance would be its previous life time high (1546.95 - 24.5% from the current price 1241.95).
4) Recommendation - Strong Buy

Zeel Trading View: Bullish Momentum Signals Potential Breakout tZeel has been exhibiting promising signs of bullish momentum in recent trading sessions, hinting at a potential breakout above the 150 mark. This surge in momentum suggests a favorable outlook for the stock, with the possibility of a sustained upward trend towards the 180 level. In this analysis, we'll delve into the technical indicators and market dynamics supporting this view.
Technical Analysis:
Breakout Above 150: Zeel has shown resilience around the 150 level, indicating strong buying interest. A decisive breakout above this key resistance level could trigger further buying pressure and propel the stock towards higher price targets.
Moving Averages: The moving averages, particularly the 50-day and 200-day moving averages, are trending upwards, suggesting a bullish sentiment in the medium to long term. This reinforces the positive outlook for Zeel's price action.
Volume Analysis: Accompanying the recent price surge, trading volume has notably increased, indicating significant participation from buyers. Elevated volume during price advances typically validates the strength of the prevailing trend, enhancing the probability of further upside movement.
Relative Strength Index (RSI): The RSI indicator is currently indicating bullish momentum, with Zeel's RSI hovering in the overbought territory. While this may signal a potential short-term pullback, it also suggests underlying strength in the stock's uptrend.
Chart Patterns: Additionally, chart patterns such as ascending triangles or bullish flag formations may be observed, further supporting the bullish case for Zeel.
Market Dynamics:
Sectoral Momentum: Zeel operates within a sector that is witnessing heightened investor interest and positive sentiment. Favorable industry dynamics and company-specific catalysts could fuel further upside potential for Zeel.
Fundamental Factors: Fundamental factors such as strong earnings growth, favorable industry trends, and potential corporate developments could act as tailwinds for Zeel's stock price.
Conclusion:
With the stock poised for a potential breakout above the 150 level, Zeel presents an attractive opportunity for traders and investors alike. The confluence of bullish technical indicators, robust trading volume, and favorable market dynamics suggests that Zeel may be on the verge of a significant uptrend. While short-term volatility may be expected, a sustained move above 150 could pave the way for Zeel to target the 180 level and potentially beyond. As always, traders should conduct their own research and risk assessment before making any investment decisions.

NATCOPHARM - 2 years consolidation / Cup With Handle BreakoutNatco Pharma Ltd
1) Time Frame - Weekly.
2) The Stock has been in a consolidation since (January, 2022). Now It has given a breakout & Closed with strong bullish momentum in weekly time frame.
3) Next Resistance / Target will be it's previous Life Time High 1189.
4) Recommendation - Strong Buy

SANDHAR - 6 years consolidation Breakout & All Time HighSandhar Technologies Limited
1) Time Frame - Weekly.
2) The Stock has been in a consolidation since (April, 2018). It has given a breakout on November, 2023 and consolidated few weeks & It has broken the previous life time high & Closed at its All time high with strong bullish momentum in weekly time frame.
3) Recommendation - Strong Buy

SHAILY - 6 Months consolidation BreakoutSHAILY / Shaily Engineering Plastics Ltd
1) Time Frame - Weekly.
2) The Stock has been in a consolidation since (August, 2023) and It has given a breakout & Closed with strong bullish momentum & Huge volume in weekly time frame.
3) The stock may reach its previous Life Time High (478) in short Term.
4) Recommendation - Strong Buy

KPITTECH - 3 Months consolidation Breakout & All Time HighKPITTECH
1) Time Frame - Daily.
2) The Stock has been in a consolidation since (November, 2023). It has given a breakout & Closed at its All time high with strong bullish momentum in Daily time frame.
3) Good bullish momentum NIFTY IT Index.
4) Recommendation - Strong Buy

Trade Smart in Turbulent Times in SyngeneNSE:SYNGENE , a leading global discovery, development and manufacturing organization catering to the pharmaceutical and biotech industries, is under the spotlight for this week's technical analysis.
Entry Logic 🎯:
The stock has recently crossed its 50-day moving average (MA) of INR 799, additionally breaching the Fibonacci retracement level of 0.382 at INR 810 . These factors, combined with potential bullish crossovers in Exponential Moving Average Divergence (EMD) and Moving Average Convergence Divergence ( MACD) (12,26,9), lay down a fertile ground for upward movement. The ideal entry point would be upon a strong opening above I NR 810.2 or INR 811.60 (0.5 Fibonacci level).
Target Levels 🎯:
Target 1: INR 823.45
Target 2: INR 843.70
These targets are set based on historical resistance zones and projected upward momentum.
Exit Logic 🚪:
An exit should be considered if momentum drops or reverses before reaching the target levels, or upon hitting the targeted price points for desired profits.
Stop Loss ⚠️:
A stringent stop loss is advised at INR 786. This is a slightly aggressive level aimed at limiting losses should the market sentiment change abruptly.
Technical Indicators 📊:
MACD: Awaiting a bullish crossover to substantiate entry.
Stochastics: Recent crossover observed, bullish sign.
RSI: Also in bullish crossover territory.
%R: Currently in oversell territory - positive.
Fisher 9: Indicating strong buy signal.
Market Sentiment 🌐:
With the broader Indian market expected to exhibit volatility in the forthcoming week, caution is advisable. The high PE ratio of 64.44 and a modest EPS of 12.06 underscore a relatively high valuation, with a low payout ratio of 4.16.
Recommendation 📝:
Syngene International presents a potentially lucrative short-term swing trading opportunity for aggressive traders. The anticipated bullish momentum, if actualized, could render fruitful returns; albeit the inherent market risks necessitate a robust exit strategy and a firm stop loss.
Disclosures and Disclaimers 📢:
This analysis is for informational purposes only and not to be construed as a solicitation or an offer to buy or sell any securities or related financial instruments. The report is based on historical data and prevailing market conditions; the future may unfold differently. All investors are advised to conduct their independent research or consult a financial advisor before making any investment decisions.

#Infosys Strong Buy#infosys after making Strong Higher high and consolidating.
Best buy at CMP and hold for targets., maintaining proper Stoploss.
good to hold for targets of range 1600/1700/1800.
use your own technical analysis before any trade

SIGACHI INDUSTRIES - 2 Years consolidation / IPO Base BreakoutSIGACHI
1) Time Frame - Monthly.
2) The Stock has been in a consolidation / Downtrend since its listing (November, 2021) and has given an IPO base / Previous Life Time High breakout & Closed with strong bullish momentum & Good volume in monthly time frame.
3) Since it is a cup pattern breakout, The stock may reach the target (182) as per the cup pattern breakout target in the Long Term.
4) Recommendation - Strong Buy

ITDC / INDIA TOURISM - 6 years consolidation breakoutITDC
1) Time Frame - Weekly.
2) The Stock has given 6 years consolidation breakout with huge volume & strong bullish candle close in weekly.
3) The next target / resistance would be its previous life time high (747 - 17% from the current price 636.70).
4) Recommendation - Strong Buy

INFIBEAM - 5 years Consolidation BreakoutINFIBEAM
1) Time Frame - Monthly.
2) The Stock has been in a consolidation zone / Downtrend since 2018 and has given a breakout & Closed with strong bullish momentum & Huge volume in monthly time frame.
3) INFIBEAM may reach its previous Life Time High (50.50) in the Long Term.
4) Recommendation - Strong Buy

BRNL / Bharat Road Network - Pre Covid High / Consolidation B/OBRNL
1) Time Frame - Monthly.
2) The Stock has been consolidating since January, 2020 and has given a pre covid high breakout & Closed with strong bullish momentum & Huge volume in monthly time frame.
3) BRNL may reach its previous Life Time High in the Long Term.
4) Recommendation - Strong Buy

LICI / Life Insurance Corporation of India - IPO Base Breakout.LICI
1) Time Frame - Monthly.
2) The Stock has been in a downtrend or consolidation since its IPO listing - May, 2022 and has given an IPO base breakout with strong bullish momentum & Huge volume.
3) The stock may perform well in the long term.
4) Recommendation - Strong Buy

DVL / Dhunseri Ventures Ltd - 2.5 Years Consolidation Breakout.DVL
1) Time Frame - Monthly.
2) The Stock has been consolidating since August, 2021 and has given a breakout with strong bullish momentum & Huge volume.
3) The stock will find resistance / profit booking zone around the price (940) in long term.
4) Recommendation - Strong Buy

ZUARI / Zuari Agro Chemicals Ltd - 5 Years High BreakoutZUARI / Zuari Agro Chemicals Ltd
1) Time Frame - Monthly.
2) The Stock has been consolidating since April, 2019 and has given a breakout with strong bullish momentum & Huge volume.
3) The stock may reach its previous Life Time High (690) in the long term.
4) Recommendation - Strong Buy

PAKKA / PAKKA LIMITED - All Time high - BreakoutPAKKA
1) Time Frame - Weekly.
2) Stock has given a breakout with huge volume & strong bullish candle close in weekly.
3) The next target would be around the price (460 - 19%) from the current price 385.45.
4) Recommendation - Strong Buy

MANAKSKIA STEELS LTD - Triangle Pattern & Previous ATH BreakoutMANAKSTEEL
1) Time Frame - Weekly.
2) Previous Life Time High was 64. It has been consolidating in a triangle pattern since 2022 & given a breakout in weekly time frame currently.
3) It's a Triangle pattern & All Time High breakout with strong bullish candle & Good volume.
4) Stock will find its next resistance around the price 80 (17%).
5) Recommendation - Strong Buy

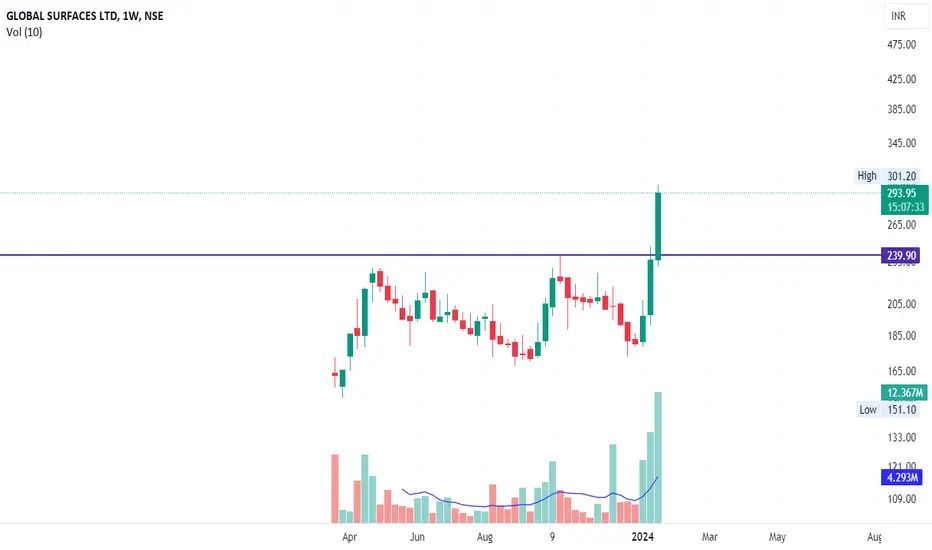
GSLSU / Global Surfaces Ltd - Consolidation / IPO Base BreakoutGSLSU
1) Time Frame - Weekly.
2) Previous Life Time High was 239.30. It has been consolidating since 2023, March & given a breakout in weekly time frame currently.
3) It's a consolidation / IPO base breakout with strong bullish candle & Good volume.
4) Recommendation - Strong Buy
HPAL / HP ADHESIVES LTD - 1 Yr Consolidation / IPO base breakoutHPAL
1) Time Frame - Weekly.
2) Previous Life Time High was 109.30. It has been consolidationg since 2022 January & given a breakout in weekly time frame currently.
3) It's a consolidation / IPO base breakout with strong bullish candle & Good volume.
4) Recommendation - Strong Buy

KTKBANK / KARNATAKA BANK - Previous All Time High BreakoutKTKBANK
1) Time Frame - Weekly.
2) Previous Life Time High was 194.60 in the year 2008. It was broken on July 2023 & Sustained / Consolidated for 6 months above the price 194.60 and marked a breakout with strong bullish candle and closed at All Time High currently.
3) The next resistance would be in between the price 300 to 314.
4) Recommendation - Strong Buy

NIFTY ready for new rally..?As we can see NIFTY has finally able to close above the trendline which signifies a strong buying being made hence we can expect every dip as a buying opportunity till this weekly doji kinda candle is not broken below which could lead to a strong fall so plan your trades accordingly

5PAISA / 5PAISA CAPITAL LTD - Previous All Time High Breakout1) Time Frame - Weekly.
2) Previous All Time High was 580 in the year 2021 July. It has been broken out and closed with strong bullish candle & volume in Weekly.
3) As the primary trend (Black line) acts as a resistance since all these years the stock will find its resistance there (around the price - 935).
4) Recommendation - Strong Buy
